03 October 2017
Post by Chris Mason, Next Level Research
E: [email protected]
A record run of economic growth
The numbers are impressive, with the June quarter ABS figures showing 26 years of uninterrupted economic growth. In the past decade alone Australia’s GDP has grown by an average of 2.5% per year despite the global financial crisis, the downturn in mining investment, and the managed slowdown of the Chinese economy.
Table: Australia’s economy by the numbers
| Economic measure | Latest figure | Annual change (%) | Comment |
| GDP growth (ABS, chain volume and seasonally adjusted) | 0.8%, June qtr |
1.8% | The strong June quarter was partly driven by domestic spending, specifically a rise in household consumption as the saving rate fell. |
| Unemployment rate (ABS, seasonally adjusted) | 5.6%, Aug 17 |
-0.1% | An extra 0.3 million people employed since August 2016 offset by an increase in labour force participation. |
| Consumer sentiment index (Westpac- Melbourne Institute) | 97.9, Sept 17 |
-3.4% | For the tenth month straight the index has remained below 100, indicating that pessimists outnumber optimists, as family finances remain a key concern. |
| Business confidence (NAB) | +5, Aug 17 |
-1 | Despite a sharp fall in August, confidence levels are positive across all industries with business conditions elevated. |
However, other recent releases reaffirm a common theme, that Australian households are under increasing financial pressure. Rising mortgages and sluggish income growth have driven this shift, showcasing the need to look beyond growth when it comes to measuring the health of our economy.
Stepping away from the pulpit, the news is not all doom and gloom, we are not on a highway to economic disaster. The included table shows that the economic news is mixed, though the following paragraphs highlight that our economy is increasingly vulnerable to sudden shocks, such as another global crisis.
Though households face increasing financial pressure
The Centre for Social Impact in partnership with NAB recently unveiled their Financial Resilience in Australia 2016 report, highlighting the increasing financial vulnerability of Australian households. The report’s survey of over 2,000 respondents revealed a significant fall in the proportion of ‘financially secure’ adults, from 35.7% in 2015 to 31.2% in 2016.
The changing financial situation of Australians was not all on the downside, with the proportion of respondents who could access funds in an emergency (that is raise $2,000 in one week) increasing from 77.6% in 2015 to 81.4% in 2016. However, this still means that just over 18% of those surveyed did not know if they were able to or could not raise $2,000 in one week.
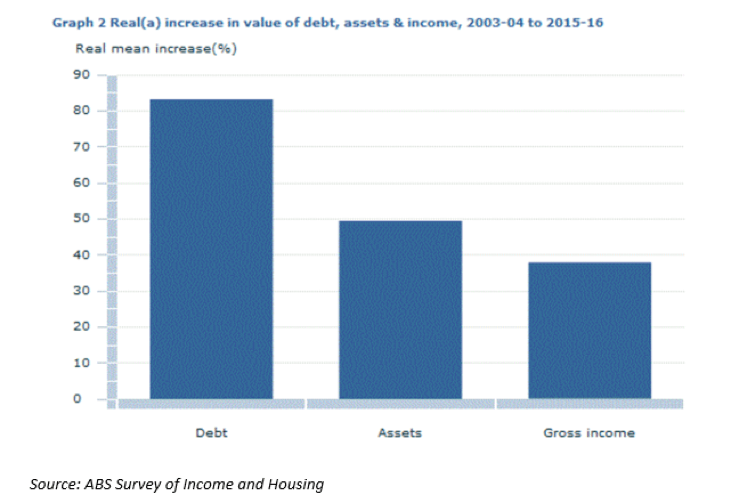
As debt outpaces income and asset growth
Debt is critical to our economy, but the recent release by the ABS covering household income and wealth shows the increasing pressure on Australian households. Between 2003-4 and 2015-16, the proportion of households with debt has remained roughly steady at almost 3 in 4, yet after adjusting for inflation average household debt has jumped from $94,100 to $168,600.
This rising pressure on Australian households has been driven by this debt increase significantly outpacing the growth in income and assets over the same time frame (see ABS graph). The ABS commentary noted the vulnerability of households to economic shock, whether on an individual level (e.g. job loss) or macro level (e.g. rise in interest rates). As it stands, the data indicates that around 29% of households with debt were ‘over-indebted’ in 2016, up from 21% in 2003-04.
This debt increase has been mainly driven by rising property debt, standing at $149,600 on average in 2015-16. In contrast, income growth was slowed to an almost stop by the GFC, with average weekly household income rising by only $27 in real terms to $1,009 between 2007-08 and 2015-16. The increasing debt has delivered a lift in average household wealth, up 11% to $929,400 in the last two years alone. Average wealth is well ahead of average debt, but most of the former consists of illiquid property assets, which are difficult to access in case of sudden economic shocks.
A further look at the ABS statistics show some interesting trends for debt around age and wealth. Younger households with property debt were more likely to be over indebted, while wealthier households were more likely to be holding debt. Corelogic has taken a more detailed look at the debt profile of Australian households shown in the ABS data.
Next Level Research is an associate of the BCCM that offers tailored research to co-operatives and mutuals, understanding and recognising the value of the member owned model. Contact BCCM if you would like an in-depth briefing from NLR for your directors or executives on the findings in this blog.
Latest news

First international Accreditation of Mutual Value presented

Finding senior leaders: A recruitment guide for co-ops and mutuals – Part 3